使用 Go 编写的 HTTP 服务器插桩
在本教程中,我们将创建一个简单的 Go HTTP 服务器,并通过添加一个计数器指标来对其进行插桩,以统计服务器处理的总请求数。
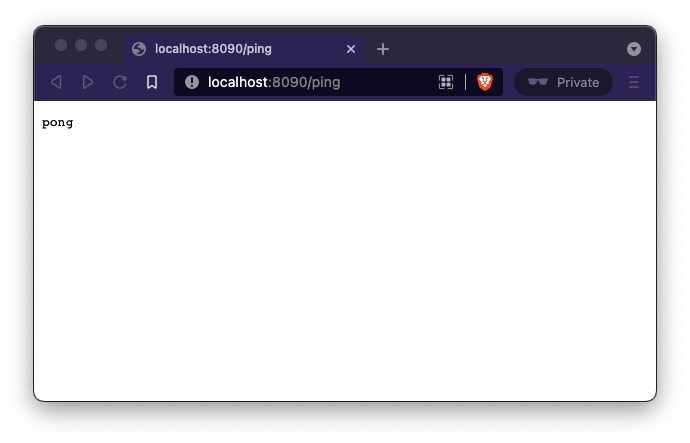
这里我们有一个简单的 HTTP 服务器,带有一个 /ping 端点,它返回 pong 作为响应。
package main

import (
   "fmt"
   "net/http"
)

func ping(w http.ResponseWriter, req *http.Request){
   fmt.Fprintf(w,"pong")
}

func main() {
   http.HandleFunc("/ping",ping)

   http.ListenAndServe(":8090", nil)
}
编译并运行服务器
go build server.go
./server
现在在浏览器中打开 https://:8090/ping,你应该会看到 pong。
现在让我们为服务器添加一个指标,该指标将记录对 ping 端点的请求数量,计数器指标类型非常适合这种情况,因为我们知道请求数不会下降,只会增加。
创建一个 Prometheus 计数器
var pingCounter = prometheus.NewCounter(
   prometheus.CounterOpts{
       Name: "ping_request_count",
       Help: "No of request handled by Ping handler",
   },
)
接下来,让我们更新 ping 处理程序,使用 pingCounter.Inc() 来增加计数器的计数值。
func ping(w http.ResponseWriter, req *http.Request) {
   pingCounter.Inc()
   fmt.Fprintf(w, "pong")
}
然后将计数器注册到默认注册器并暴露指标。
func main() {
   prometheus.MustRegister(pingCounter)
   http.HandleFunc("/ping", ping)
   http.Handle("/metrics", promhttp.Handler())
   http.ListenAndServe(":8090", nil)
}
prometheus.MustRegister 函数将 pingCounter 注册到默认注册器。为了暴露指标,Go Prometheus 客户端库提供了 promhttp 包。promhttp.Handler() 提供了一个 http.Handler,它会暴露在默认注册器中注册的指标。
示例代码依赖于
package main

import (
   "fmt"
   "net/http"

   "github.com/prometheus/client_golang/prometheus"
   "github.com/prometheus/client_golang/prometheus/promhttp"
)

var pingCounter = prometheus.NewCounter(
   prometheus.CounterOpts{
       Name: "ping_request_count",
       Help: "No of request handled by Ping handler",
   },
)

func ping(w http.ResponseWriter, req *http.Request) {
   pingCounter.Inc()
   fmt.Fprintf(w, "pong")
}

func main() {
   prometheus.MustRegister(pingCounter)

   http.HandleFunc("/ping", ping)
   http.Handle("/metrics", promhttp.Handler())
   http.ListenAndServe(":8090", nil)
}
运行示例
go mod init prom_example
go mod tidy
go run server.go
现在多次访问 localhost:8090/ping 端点,然后向 localhost:8090 发送请求将提供指标数据。
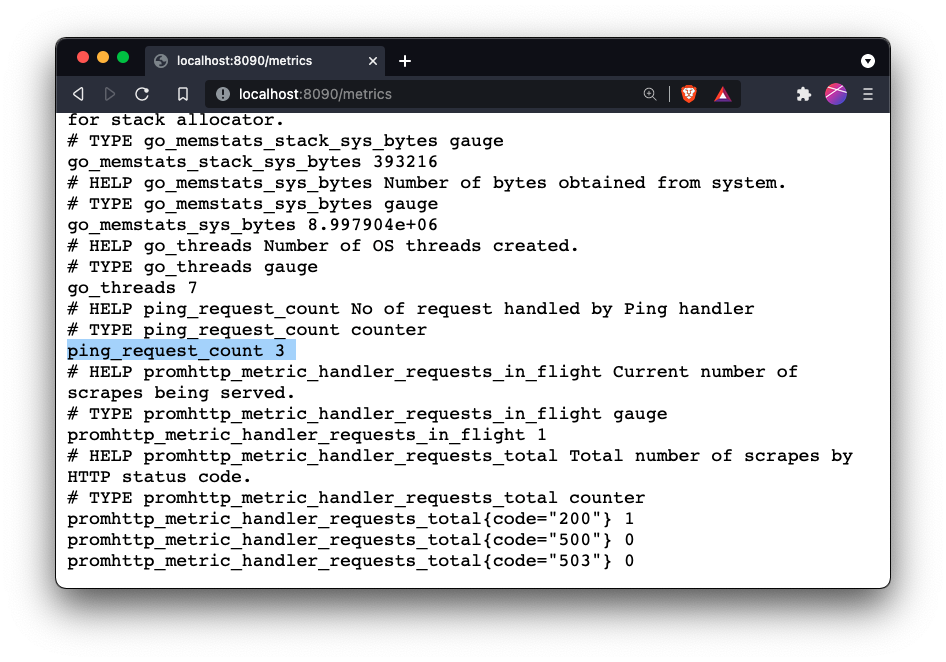
这里的 ping_request_count 显示 /ping 端点被调用了 3 次。
默认注册器带有一个用于收集 Go 运行时指标的收集器,这就是为什么我们能看到其他指标,如 go_threads、go_goroutines 等。
我们已经构建了第一个指标导出器。让我们更新 Prometheus 配置,以便从我们的服务器抓取指标。
global:
  scrape_interval: 15s

scrape_configs:
  - job_name: prometheus
    static_configs:
      - targets: ["localhost:9090"]
  - job_name: simple_server
    static_configs:
      - targets: ["localhost:8090"]
prometheus --config.file=prometheus.yml